
This blog post has been updated since the new WinDbgX debugger was moved to a release phase.
Preface
Kernel debugging of any kind is not for the faint of heart. And it doesn't help that most tools for kernel debugging in existence today are designed in a very poor style, are very costly, and are lacking basic features that we take for granted in pretty much any other software. And piled on top of that, even the installation of your workbench system for kernel debugging is in no way easy, either. Thus, no wonder, there are so few people who understand and do kernel debugging well.
In this blog post I will try to demystify the intricacies of installation and setup of a Windows kernel debugger.
And, for those that don't like reading through long blog posts, make sure to check my video recap at the end.
Table of Contents
This blog post turned out to be a whopper. So it sounds like I need a table of contents for it:
- Existing Issues
- New Tools to the Rescue!
- Basic Terminology
- Prerequisites
- Installation
- Set up Network
- Configure Guest OS For Network Kernel Debugging
- Set up WinDbgX App
- Network Connection Settings in WinDbgX
- Multimonitor Setup
- Initiating Kernel Debugging
- Kernel Debugging Guest OS
- Troubleshooting
- Can't ping host PC by its name
- WinDbgX fails to connect to guest OS
- Registers are not showing values
- Registers pane shows incorrect register values
- Debugging symbols are not showing
- Breakpoint doesn't trigger
- Breakpoint freezes up or BSODs guest OS
- Disassembly window shows "garbage" after triggering breakpoint
- Guest VM is having 100% CPU utilization when breakpoint is activated
- Video Overview
Existing Issues
Like I pointed out above, there are quite a few issues that developers and reverse-engineers face while doing kernel debugging in Windows. Lets name the most frustrating ones:
- You can't do full-fledged kernel debugging on one computer, thus you're forced to use a second PC. And unless you live in a computer-repair bunker (like OSR folks) not many people can just whip out a second PC and connect it to their main one.
- Even if you managed to connect a second PC, you're immediately faced with a host of connectivity issues and no logging to understand what went wrong and why.
- But even if you got to the next stage, and connected your two PCs via an antiquated COM port, now you're literally faced with a dial-up speed of such connection. Arghh!
- So coupled with the need for frequent reboots, slow POST times and you got yourself quite an uncomfortable work environment.
Then at around year 2010 or so, developers got a pleasant surprise in the form of virtualization, or virtual machines (or VMs.) I immediately jumped on board and has been
using VMWare Workstation since. It literally saved me a ton of time for debugging my code.
But still, kernel debugging was lagging, even in the VM. The main reason was an
antiquated tool that everyone had to use on Windows for kernel debugging. Yeah, I'm talking about WinDbg.
New Tools to the Rescue!
Sort of 🤨
It took Microsoft a very long time to release their new version of WinDbg. It was originally called "WinDbg Preview", but now I see that they renamed it to just WinDbg. For me, this only adds to a bunch of confusion. Thus I will use its internal name, WinDbgX (or "WinDbg Next") as it was called internally during the development stage to differentiate it from the old WinDbg, that a lot of people may be still using.I will also remove all references in this blog post to "WinDbg Preview" and will use "WinDbgX" instead.
I also see that all of the bugs that I listed at the bottom seem to remain in the "release" version of the new WinDbg. Thus we may pretty much assume that it's still in a "preview" form.
In about year 2018 we got a pleasant surprise. A small team at Microsoft released what appeared to be an update to an archaic WinDbg, called WinDbg Preview.
(Note that the suffix "Preview" remained with it for more than 2 years later. And that is a bad sign.) Some people immediately swept this release
aside as a "joke", although I personally enjoyed using it. (Although I should admit that I was never a hardcore user of the original WinDbg. Also
this new version is definitely still in a pre-release stage, just judging by a ton of bugs that are still in it.)
So what did the new WinDbgX bring to the table?
- Well, first and foremost, the capability of maintaining a "fast" debugging connection. (I'm putting the word "fast" in quotes, because, well, it's relatively
speaking fast. This is kinda like saying that a granny with a walker is faster than a snail. But, hey, it's still progress, right!)
I also have to point out that WinDbgX by itself
is not what makes your debugger run faster. It's the debugging engine itself that got updated to support faster UDP connection that made it quicker to transmit data from and to
the
debuggeeoperating system. Thus, technically speaking, you can still reap the same benefits with the old WinDbg. But I'll have to write about that at some other time. - WinDbgX supports a much improved UI. Yes, I don't have to memorize a million of keyboard commands. And, I'm sorry, I'm not one of those people. I like to click buttons on the screen. (Disappointed?) So this new release greatly improves on that.
- There are probably other benefits in there, but I'll leave them for another time.
Basic Terminology
Before we dive into installation and setup of our fast kernel debugging connection, let me cover some basic terminology so that I don't have to explain it along the way:
- Host computer, or a host, is the main physical PC that runs WinDbgX. (I'm using a beefed up desktop tower for that, but I guess you can use a laptop too, as long as the CPU supports virtualization and you have a decent amount of RAM. I'd assume more than 8 GB would be the minimum usable amount.)
- VM is a virtual machine. In this example I will be using one provided by VMWare Workstation software. (It's a paid product. And although I would assume that you can use the free VirtualBox for your VM, I always used VMWare, so I'll stick with it for now. And no, I'm not sponsored by them.)
- Guest OS, or just a guest, is an operating system running in a
VM. - Debugger is a running instance of WinDbgX on a
hostcomputer. - Debuggee is a
guestOS running in a VM that is being debugged.
Prerequisites
That out of the way, let me point out that not everything is rosy and pretty on the horizon. There are some gotchas that still await ahead. Thus, you will have to have the following to make it all work:
Hostideally must be running Windows 10 Pro (or "Server" or "Enterprise"). I'm not sure if "Home" version would do it. I never tried it. Windows 10 is a requirement for WinDbgX. For some unknown to me reason, Microsoft decided to package it as a Windows Store app. 🙄 (But if you still use Windows 8.1, or even Windows 7 as your main PC, don't despair, there are ways to install WinDbgX there as well. And, if you're on an earlier OS, then, yes, you should despair.)DebuggeeVM must be ideally running Windows 10. I believe Windows 8.1 is supported too, but I haven't tried it. And unfortunately, from what I understand, Windows 7 is not supported. (For Windows 7 you're stuck with a slow COM-port connection.)- This set up will not allow you to fully debug kernel drivers that require access to physical hardware. Sorry. For that you still need two PCs connected by a wire.
Installation
First you need to install your debugee OS in the VM. Make sure you have a fresh copy of supported Windows OS, and
make
a screenshot of that VM before you begin messing with it.
(Just in case. So that you can roll it back if you mess something up. That way you can retry it again.)
Set Up Network
We need to set up a network connection between the guest VM and the host PC. Ideally it should be an isolated network, if you're planning to do any malware analysis on
it. Otherwise, just a simple network configuration will do. I personally prefer to set up a simple NAT in
the VMWare host. Then if I
go to Edit -> VM -> Settings in the VMWare Workstation on the host PC, while the debugee VM is selected, my configuration is set up as such:

NAT: Used to share the host's IP address for the Network Adapter device in the Hardware tab.
Then make sure that your host PC has a unique computer name and it is set up to be network discoverable:

Turn on network discovery for Guest or Public profile.
To enable network sharing on the host PC run the following command elevated:
netsh advfirewall firewall set rule group="Network Discovery" new enable=YesThen we need to make sure that firewalls on each end-point do not block us from pinging the host from the guest, and vice versa.
For that open the Windows Firewall in the host, and then in the guest operating systems. Run this command as administrator:
wf.mscLocate "File and Printer Sharing (Echo Request - ICMPv4-In)" line for "Private, Public" profile in the "Inbound Rules" list, right-click it and enable that rule:
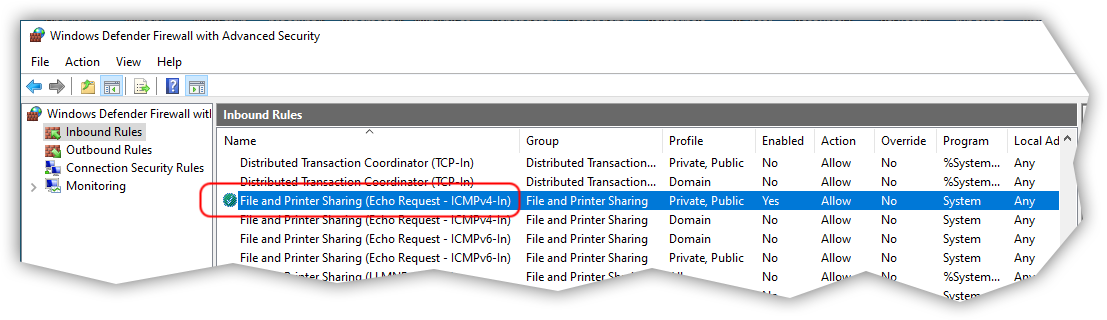
host and guest operating systems.
Then make sure that you can ping the host PC from the guest VM by its name. To get the computer name of the host PC run the following command on the host:
whoamiIn my case, the host name is "hostpc1":

The reason we're using a host name instead of a static IP is because of the way kernel debugger operates. The part of the kernel debugger embedded in the debuggee operating system loads way before any network driver (that you can usually configure through the Windows Control Panel.) Because of that, the kernel driver responsible for providing remote debugging capabilities has to use its own simplified IP address stack. It can obtain its IP address from the DHCP server that theguestVM is connected to. Or, if that fails, it will use a hardcoded fallback IP address in the169.254.*.*range. One thing to note here is that that range is not routable and works only when two end-points are connected directly to each other.
One way to address the hardcoded nature of the kernel driver stack is to use DHCP service in the VMWare host. Or, I find it simpler to allow network discovery for the host PC
and then use its host-name instead of the IP address.
Let's run the following from the guest and make sure that the host replies:
ping -4 host_name
-4 command line switch.
At this point you should be good to go with the virtual network.
Make sure that you can access the Internet from the guest though. We'll need it on the next step.
Configure Guest OS For Network Kernel Debugging
When the virtual network is properly set up, we can begin configuring the kernel debugger itself on the debuggee, or guest VM side.
For that download "Debugging Tools for Windows" onto the guest OS. Microsoft unfortunately doesn't make this step easy. You will need to
download the SDK installer first, run it on the guest OS,
then uncheck every feature offered, except for "Debugging Tools for Windows" and then install it:
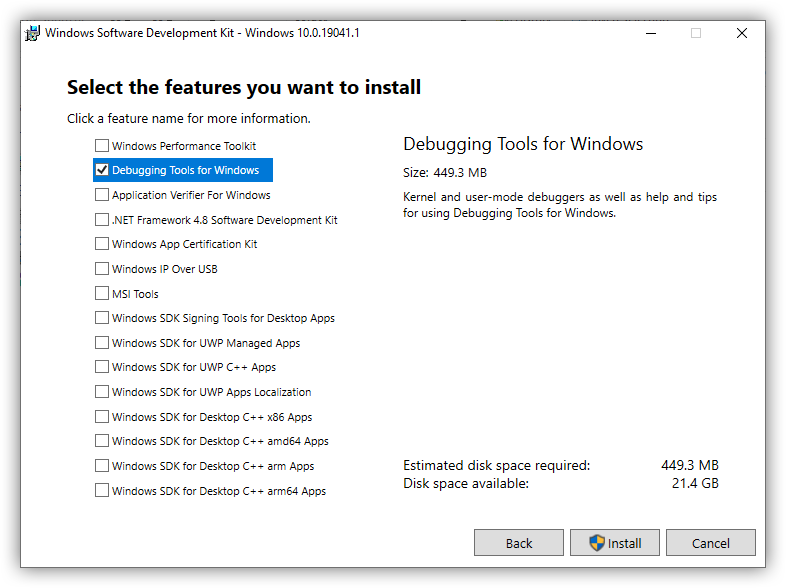
It's a shame that you will need to download 449 MB of stuff just to get a few files. (In the future, I would just copy them from one PC to another if you need to do it again.)
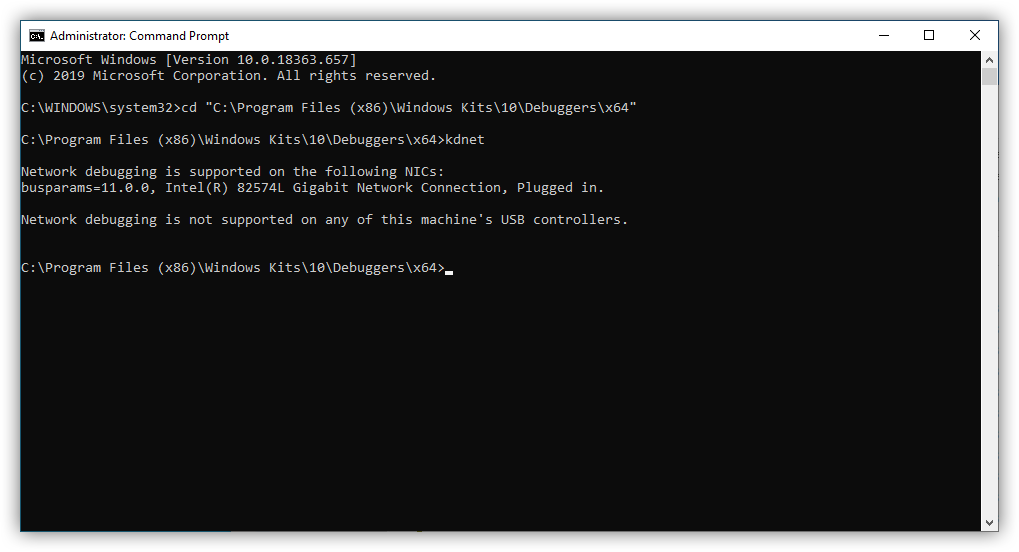
After installation completes, and assuming that you have a 64-bit guest OS, you will need just these two files:
C:\Program Files (x86)\Windows Kits\10\Debuggers\x64\kdnet.exeC:\Program Files (x86)\Windows Kits\10\Debuggers\x64\VerifiedNICList.xml
(For a 32-bit OS, you will need to look in the x86 subfolder.)
Run kdnet.exe as administrator and get its output. If all goes well, it should report at least one supported NIC:
Then generate kernel debugger connection string using kdnet.exe. For that pick a connection port in the range from 50000 to 50039, inclusive.
And run the following command in the guest OS as administrator:
kdnet host_name portIn case your client OS is Windows 11, it may have secure boot enabled. In that case you may see the following message after runningkdnet.exe:Secure boot is enabled. It must be disabled before enabling network debugging.The solution in this case is to disable "Secure Boot" before re-running thekdnetcommand above.For VMWare Workstation, make sure that you turn off the guest OS, then go to VM -> Settings -> Options -> Advanced -> and uncheck "Enable secure boot" in the "Firmware Type" section. Then save changes by clicking OK and boot the guest OS.
Also note that I'm using the host PC name that I obtained above:

kdnet hostpc1 50030
As you can see, the kdnet tool generated a random connection key 3hd86zx3atgzn.1p5p75ssdd053.3ifv7a32xvvcm.3lsskuh1vc7e0 for my provided port number 50030.
Make sure to copy and paste it to the host PC.
IMPORTANT: Keep in mind that if yourguestsystem is available from outside of your local network, treat that connection key as a password as it can be used to access everything on theguestcomputer!
Lastly, make sure that you can ping the guest from the host PC. For that, first obtain the current IP address of the guest by running ipconfig on it:
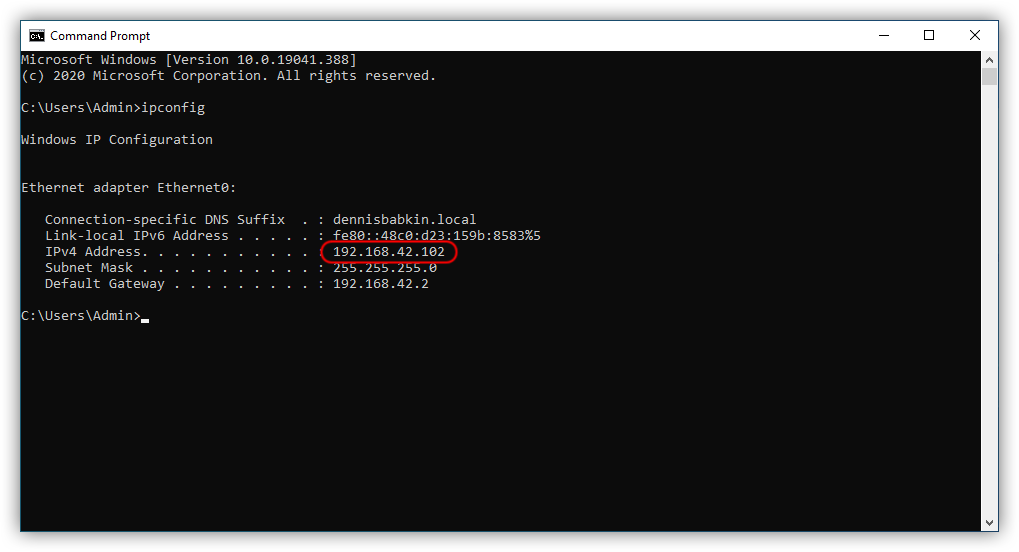
And then ping it from the host PC:
ping -4 guest_ipThe ping should succeed:

host OS.
Set up WinDbgX App
This part is somewhat easy. Download the WinDbgX app installer to the host PC.
The WinDbgX package should install automatically. Luckily, Microsoft really streamlined installation of their
new .appx packages, which is a huge leap forward in comparison to the archaic MSI's.
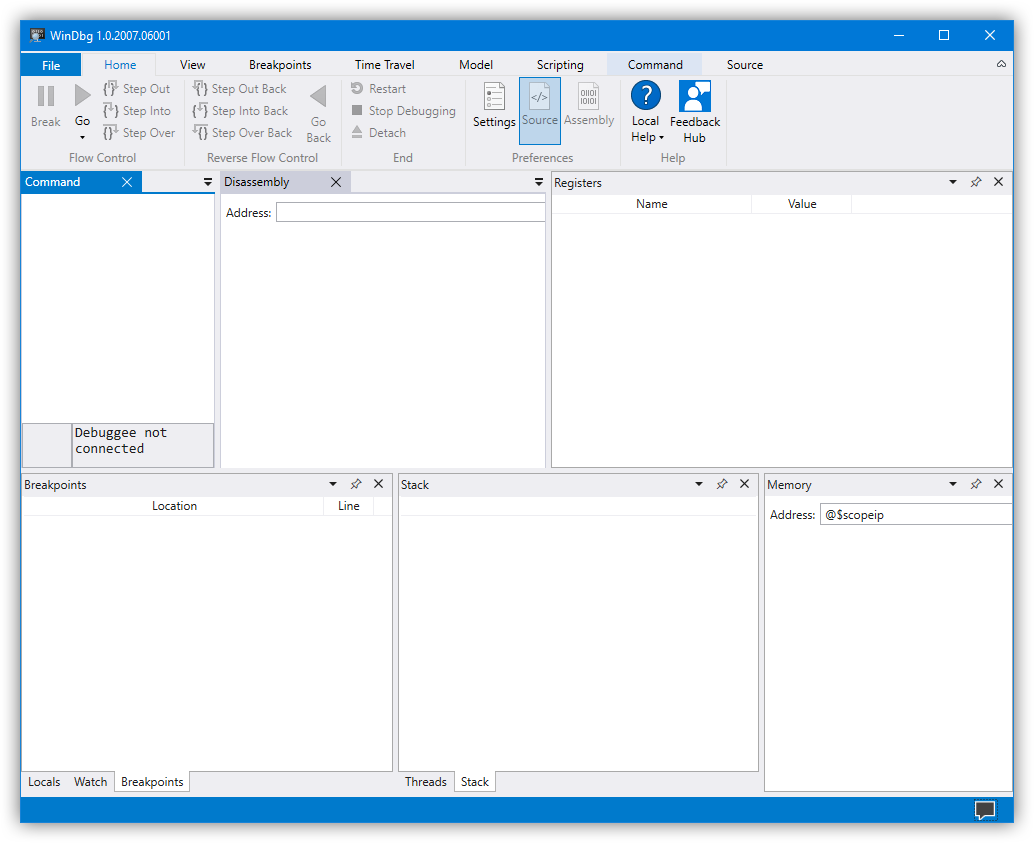
If all goes well, WinDbgX should be installed on your host. This is how it looked like when I first ran it on my host PC:

I'm not a big fan of that layout. So I usually modify it to look something like this: (Note that it's my personal preference, and you don't have to do this.)
Note that at some point after you install and run WinDbgX app, your firewall on the host computer may show a warning that it blocked opening of some ports.
For Windows Defender, it may look like this:

Windows Defender Firewall has blocked some features of Debug Engine Host Process on all public and private networks.
\microsoft.windbg_1.2007.6001.0_neutral__8wekyb3d8bbwe\amd64\enghost.exe
Make sure to check, or "allow" both "Private" and "Public" networks in such dialog and click "Allow access" to confirm.
guest OS to begin kernel debugging. To fix that later, you will have to go to the Windows Firewall
to configure it manually. Try to avoid doing it, as I don't know for sure which Windows Firewall settings this dialog enables by default. If you don't select the
right options here, your other recourse will be to revert to a previously saved "Restore Point" on the host and repeat installation of WinDbgX again.
You will simplify your life if you select the right options from the get-go.
Network Connection Settings in WinDbgX
Now the final step is to configure the network connection settings in WinDbgX. For that, go to File -> Start debugging ->
Attach to kernel -> make sure that the Net tab is selected, and copy-and-paste the Port number and the Key from the connection string that you
obtained from running the kdnet tool on the guest OS.
Leave the Target field blank. (By leaving it blank you will allow the kernel debugger on your host PC to connect to any
properly configured guest VM.)
The Initial break setting is intended to initiate a breakpoint in the guest OS immediately after connection is established.
Having done all this, my configuration in WinDbgX looked like this:

To begin connecting click OK. Initially you will only see the following message in the Command window:
Microsoft (R) Windows Debugger Version 10.0.20153.1000 AMD64
Copyright (c) Microsoft Corporation. All rights reserved.

Using NET for debugging
Opened WinSock 2.0
Using IPv4 only.
Waiting to reconnect...
To attach the kernel debugger, reboot your guest OS, as it is described below.
Multimonitor Setup
This is, by all means, not a prerequisite. But it is, by far, one of the most useful purchases that I've made that greatly facilitated my debugging in a VM.
So if you can buy two (or more) monitors for your host PC, I would strongly recommend that you do so. Here's a screenshot of my two monitors, side-by-side as they are
shown in this screenshot:

Host debugger is on the left, and guest debuggee OS is on the right.
Initiating Kernel Debugging
There are two ways how you can start kernel debugging of the guest OS:
- During the OS boot sequence.
- While the OS is running.
For either one start WinDbgX app on the host PC. (No elevation is needed.) Then go to File -> Start debugging ->
Attach to kernel -> and switch to the Net tab. It should already have your previous connection settings remembered.
(If not, you'll have to provide them. WinDbgX should remember them the next time you load it.)
Click OK to begin attaching to the guest OS.
To break immediately after connecting, make sure that Initial break is checked.
If you want to debug the guest OS kernel during the boot sequence, initiate a reboot in it:
shutdown -r -t 0Then when the guest OS is loading, you should see WinDbgX displaying status information in the Command window and eventually breaking in the guest OS:

Alternatively, if you loaded the guest OS without the Initial break option, you can always stop it by clicking Break button in WinDbgX:

guest OS.
Kernel Debugging Guest OS
This blog post is definitely not a tutorial on kernel debugging. The following is just a very basic overview to get you started. But, in a sense of WinDbg commands and UI, kernel debugging is somewhat similar to the user-mode debugging. (Maybe I'll write a separate blog post on kernel debugging if time permits.)
When you just broke into the guest OS, WinDbgX app should indicate that in its UI, and the Disassembly window should display the location in the kernel where
the initial breakpoint was triggered:
You can then use your usual navigation keys F8 for Step-Into, F10 for Step-Over, or Shift + F11 for Step-Out to
proceed through the code:
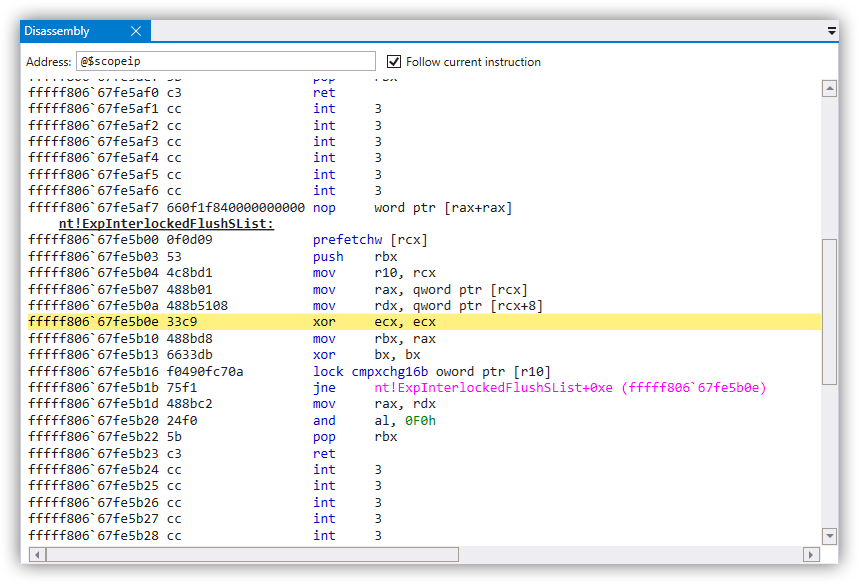
nt!ExpInterlockedFlushSList kernel function.
Obviously when the guest OS is broken into by a kernel debugger, you will not be able to communicate with it. It will appear frozen.
To release the guest OS, click Go button in the UI, or press F5 on the keyboard.
To Stop Debugging Guest OS
If you wish to temporary stop kernel debugging of the guest OS, click Stop Debugging or Detach button in its UI:

To Disable Kernel Debugging of Guest OS
If you do not wish to have guest OS to be available for kernel debugging, run the following command in it elevated:
bcdedit /debug offThen reboot the guest OS.
After that the kernel debugger from the host will not be able to connect to that guest OS.
If you want to re-establish the kernel debugging of the guest back,
run the following command in it elevated:
bcdedit /debug onAnd reboot the guest OS.
Troubleshooting
OK, I understand that this section can turn into a can of worms with a million things that can go wrong. So for now, let me recap the most common problems that can happen. Also keep in mind that I am not a developer of this debugger. I've encountered these fixes via my own trial-and-error process. And, if the issue you have isn't here, then I probably don't know how to resolve it.
Finally, the best advice that I can give you: if something doesn't work, revert your guest VM to a saved state (that you should've created before attempting
anything that I described here.) Then simply go back to the top of this page and make sure that you follow everything step-by-step in the correct order.
Can't ping host PC by its name
Aside from a possible misconfiguration in the network settings in the VM (which you should check first: stuff like both host and guest being on the same local
network, or on the same virtual NAT, if you're using one, etc.) my next guess would be that the host PC doesn't have
a unique name on your local network (that includes all your VMs, by the way).
To make it unique simply add a bunch
of random numbers to existing name of the host PC and reboot it.
Lastly check the virtual Network & NAT settings in the VMWare Workstation. For that go to Edit -> Virtual Network Editor.
Then also, when guest VM is running, go to VM -> Settings -> switch to Network Adapter and check settings there.
There are many network configurations that could be used here. So I can't give you any specifics.
My proposed virtual network configuration (that works for me) is described above.
WinDbgX fails to connect to guest OS
This is a very common problem. A true symptom that you have an issue in your configuration is when you see the following message when the guest OS boots up and
you specified the host debugger to perform "Initial break":
Using IPv4 only.
Waiting to reconnect...
There's nothing special to suggest here. Simply revert your VM to a saved (initial) state and follow all steps one-by-one in the order I presented them here.
I've seen this happen in the following erroneous scenarios:
- I was attempting to use static IP for the guest OS. Instead, I didn't need to specify any IP in the
targetfield of the kernel debugger in WinDbgX, and should've kept theguestIP address as dynamic. - I was using an IP address for the
hostin thekdnet host_name portcommand. Instead I had to use the host name. - I had
guestOS on a different virtual NAT than thehost. - I hadn't rebooted
guestOS after runningkdnetorbcdeditcommands. - I didn't copy the auto-generated key from running
kdnet host_name portcommand correctly to thehostPC. If the key that the tool generates is too complex for you, you can change it by usingbcdeditas such:bcdedit /dbgsettings net hostip:<ip> port:<port> key:a1.b2.c3.d4Where
a1.b2.c3.d4is the key you choose. The key has to have 4 sections, separated by three dots, where each section can only contain letters [a-z] and digits [0-9]. Please note that you will need to specify some random IP there. Just make sure to runkdnet host_name portcommand again to reset it to the host-name afterwards. - Instead of setting up
guestOS for "NAT: Used to share the host's IP address" I was using "Custom: Specific virtual network" in the "Network Adapter" options of the VM settings.
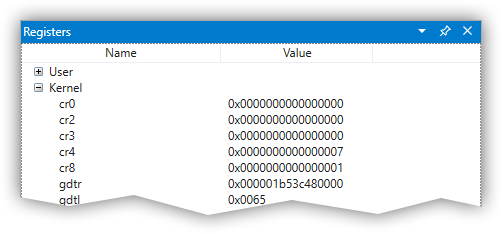
Registers are not showing values
When you break into the guest OS kernel, the Registers window may show "Unexpected failure to dereference object" for all registers:

This is a bug either in WinDbgX or in the debugging engine. What works for me is to detach the WinDbgX kernel debugger, close WinDbgX app, and then re-attach it back. This seems to fix the issue for me. (At times I have to do it more than once.)
Also this is almost always the case if you break into the guest OS while it was booting.
As a fallback, remember that you can always use the r command to manually pull up some register's value:
r raxRegisters pane shows incorrect register values
OK, this one is really stupid. I reported it to them, but it seems like nothing had been done (to date.) This is a visual bug in the UI, when the Registers window
has a list-view control whose Value column is not expanded far enough, so it cuts off long 64-bit hex numbers. Here's an example:

Simply drag the list-view header control divider to the right to see full register values:
Unfortunately though, this bug will repeat itself when you load up WinDbgX again.
Debugging symbols are not showing
This has been an issue for as long as I remember myself:

There's no one solution as far as I can tell. And just as in the old WinDbg, we'll have to resort to trying a bunch of things. Here's the list:
- Check that the
hostPC has internet connection. - Enable verbose output for loading symbols with the following command:
.symopt+0x80000000The
0x80000000flag enablesSYMOPT_DEBUGoption. You can check that it was enabled by issuing.symoptcommand without any parameters.After enabling verbose symbol loading, make sure to check the
Commandwindow for any error messages concerning loading of symbols. This will be your best bet to determine what's causing the problem. Also make sure to check error codes. To convert an error code to a human-readable error messages, use WinApiSearch tool (in it go toView->Error Code Search, type the error code and search with theSystem32preset.) - Make sure that your firewall is not blocking the
symbol server
on your
hostPC. - Reload symbols by issuing
.reloadcommand. - Restart WinDbgX app. This is the last ditch attempt, in my book.
- If it still failed to load symbols try to load them manually for the module in question.
- Lastly, keep in mind that the module may not have any publicly available symbols.
Breakpoint doesn't trigger
Obviously make sure that you set the address and triggering conditions correctly.
It helps if you don't try to do it at 4 AM, and then keep repeating the same mistake over and over again without realizing it. I've been there before.
Otherwise, some breakpoints may not always trigger. This depends on where you placed them in the kernel and also on the type of the breakpoint you used.
For instance, if you placed your breakpoint in the beginning of the nt!KiSystemCall64* class of functions:

Such breakpoint may not trigger, or it will crash or hang the guest OS when the kernel debugger attempts to break on it. This happens because of a critical
nature of the piece of code that is executing at the time when the breakpoint triggers. In the example above, the swapgs instruction is called first right
after the CPU is transitioned into ring-0 from a user-mode, following the syscall instruction. Thus, neither kernel stack, nor vital gs segment register are set up yet.
So if you placed a breakpoint on that instruction, the kernel debugger will attempt to execute its debugging loop at that critical moment, which will most certainly
result in a crash, or a hang, of the guest OS.
As a solution, you need to set your breakpoints only when the stack, or rsp register, page table, or cr3 register, and the gs segment register are already set.
So for the example above,
setting a breakpoint at the address fffff801`408241ad, on the instruction shown below, will not cause a crash or a hang in the guest OS:
Breakpoint freezes up or BSODs guest OS
Same as I described above. Some breakpoints may interfere with the operation of the guest OS, while some may be too slow for an
exceptionally busy piece of kernel code. The same nt!KiSystemCall64* class of functions is a good example of such code. They are executed many many times per second, as
the entry point for the transition between the user-mode and the kernel code, and thus any slight slow-down in such critical part of the kernel code may significantly reduce
the speed with which the guest OS operates.
Additionally, any software breakpoint (especially with conditional options) is executing phenomenally slow for such a critical part. For instance, if you try to set the
following software breakpoint on one of the nt!KiSystemCall64* functions:
bp fffff801`408241ad ".if (@rax == 0x55) { .echo match } .else { gc }"It will not crash the guest, but it will make it run exceptionally slow if condition never evaluates to true. This may even look like
a hang. (The reason you will know that it's not a hang is by being able to break into kernel after you Go it.)
Solution: Use hardware execution breakpoints where possible. They do not slow down execution of code:
ba e 1 fffff801`408241adThe downsides of hardware breakpoints:
- Their number is limited by the CPU. In most cases there are only 4 of them.
- WinDbg's kernel debugging engine doesn't seem to support conditions for them.
Disassembly window shows "garbage" after triggering breakpoint
This may happen from time to time. I don't know what's causing it. In all honesty, it looks more like a bug to me.
A workaround that seems to have worked was to single-step through the code for a few times (you can press F8 on the keyboard for that.) This little trick seems to clear the disassembly window for me.
Guest VM is having 100% CPU utilization when breakpoint is activated
I'm not sure how to classify this one. It may be a bug, or it may be a feature. 😁
While the guest OS is in the kernel debugging loop, or when you activated a kernel breakpoint, it may be using 100% of the CPU utilization on that VM.
This is probably caused by the kernel debugging loop logic, that is embedded in the guest OS. During a normal operation, Windows kernel
invokes power saving CPU instructions to minimize power consumption and to reduce CPU clock cycles. But, after you enter a kernel
breakpoint, no regular kernel logic can run since the kernel is now "looping" in the debugging loop. My guess is that they either
made a mistake by not including any power saving CPU options in the debugging loop, or there're some limitations that I'm not aware of.
By "mistake in logic" I mean relying on a debugging loop similar to this pseudo-code:
Such a loop will "eat up" a lot of CPU cycles if it's allowed to loop in an infinite JMP cycle.
Unfortunately there's no workaround for this. You will have to release the breakpoint by clicking Go in the UI, or by pressing F5 on the keyboard.
Video Overview
And lastly, here's a video recap of what you've just read above: